Tariffs and Their Impact on Your Portfolio
By Gene Balas, CFA®
Investment Strategist
Summary
- The recent tariffs proposed by the Trump Administration have the potential to meaningfully slow US economic growth, and contribute to inflation in 2025.
- Key Industries likely to see price increases include Auto Parts, Textiles, Energy, and Lumber. Import cost increases threaten margins for companies downstream of these inputs.
- There remains significant uncertainty related to both the shape and timing of tariffs; we believe investors should focus on longer term trends in company earnings, Fed policy, and economic growth rather than reacting to the fluid political landscape.
Introduction
The Trump Administration recently announced 25% tariffs on all goods imported from Canada and Mexico (but with a carve-out for energy imports from Canada, which will have a lower 10% tariff), as well as a 10% tariff on imports from China. Combined, Mexico, China and Canada account for more than a third of the products brought into the United States, accounting for more than $1 trillion in goods a year, according to data from the U.S. Census Bureau.
In response to the tariffs, both Canada and Mexico announced retaliatory measures. Canada planned 25% tariffs on $105 billion of U.S. goods, including alcohol, clothing, and vehicles. Mexico has indicated it will also retaliate. The consequences of this trade war could include higher prices for consumers, job losses, and a rise in inflation, according to economists.
In 2023, the U.S. ran significant trade deficits with both Mexico ($152 billion) and Canada ($40 billion) according to the US Census Bureau. This imbalance highlights the economic dependence on these neighboring countries. The new tariffs, especially on auto parts, could exacerbate these deficits and disrupt local economies, particularly in states like Michigan, Ohio, and Tennessee, where auto manufacturing is central.
Currently, the tariffs on both Mexico and Canada have been postponed by 30 days to allow the Mexican and Canadian governments to negotiate potential resolutions to some of President Donald J. Trump’s demands. For example, Mexican President Claudia Sheinbaum announced she would send 10,000 Mexican national guard troops to the border to help stem illegal migration of people into the U.S. from its southern border, as well as to help stem the flow of fentanyl into the U.S. Tariffs on China, however, have not been delayed, and China has pledged retaliation, although its scope has been relatively restrained.
As such, there remains the possibility that the nature or contours of tariffs may change, if and when they might be implemented. We will be following any new developments closely and will provide any material updates accordingly.
The Economic Impact of the Tariffs and Retaliatory Measures
The Tax Foundation estimates the tariffs would shrink economic output by 0.4% and increase taxes by $1.2 trillion between 2025 and 2034, amounting to an average tax increase of more than $830 per US household in 2025.
Using modeling that the Fed used during Trump’s first term, Bloomberg estimated the trade war could knock 1.2% off US gross domestic product and add about 0.7% to a widely watched indicator of core inflation. Goldman Sachs, meanwhile, estimates the tariffs on Canada and Mexico, if sustained, would reduce economic output by 0.4% and add 0.7% to consumer prices.
Economists predict that the tariffs will disproportionately affect poorer households, which spend a larger share of their disposable income on goods. In the worst case scenario, when shoppers don’t substitute for US-made goods and 100% of the tariffs is passed onto consumers, the potential economic impact could work out to roughly $835 per person, or $3,242 for a family of four, according to ING.
The overall impact of the tariffs on the U.S. economy could be severe. The tariffs are expected to increase costs for U.S. companies by $700 million per day, according to Trade Partnership Worldwide. In total, the Tax Foundation estimates the tariffs are projected to hit $1.4 trillion of imports, primarily from U.S. allies, which is a stark contrast to earlier tariffs, which focused mainly on China.
U.S. inflation, at 2.9% in December, is still running higher than the Federal Reserve’s 2% target, according to the U.S. Bureau of Economic Analysis. The Peterson Institute estimated that U.S. inflation would be 0.54 percentage point higher with the tariffs this year than without. The U.S. depends on Canada for most of its imported oil, which is refined into gasoline in the Midwest, while Mexico is a supplier of everything from fruits, vegetables, meat and beer to electronics, household appliances and medical equipment.
Furthermore, note that higher prices from tariffs on imported goods from Canada, Mexico, and China can give cover to U.S. producers of competing goods to raise their own prices. In other words, U.S. firms can also increase the prices they charge for goods produced entirely in the U.S., as even at a somewhat higher price, those U.S.-made goods can still be cost-competitive with now more-expensive imported goods. This would further amplify the inflationary aspects of the tariffs.
Historical Perspective on Trump’s Earlier Tariffs
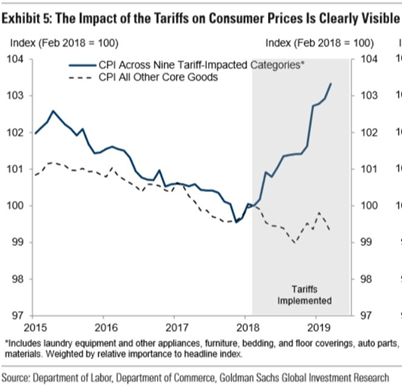
The tariffs implemented by former President Donald Trump in 2018 had significant effects on the stock and bond markets, as well as the broader economy. Trump’s trade war began in early 2018 with tariffs aimed at China and other countries. The key measures included:
- March 2018: 25% tariffs on steel and 10% on aluminum.
- July & August 2018: Tariffs on $50 billion of Chinese imports.
- September 2018: 10% tariffs on an additional $200 billion of Chinese goods (which was set to rise to 25% in 2019).
- China’s Retaliation: Imposed tariffs on U.S. agricultural products, automobiles, and industrial goods.
The stock market initially reacted negatively to Trump’s tariffs, particularly in early 2018 and again in late 2018, when trade tensions escalated. This resulted in the S&P 500, Dow Jones, and Nasdaq indices seeing sharp declines in early 2018 due to concerns over a trade war. The Dow Jones Industrial Average (DJIA) fell nearly 1,100 points (over 4%) in the days following the steel and aluminum tariff announcement in March 2018.
Technology and industrial stock were hit hard in that period. Companies with significant supply chains in China (such as Apple, Boeing, Caterpillar, etc.) saw declines. The escalation of the trade war contributed to a broader market downturn in Q4 2018. The S&P 500 fell nearly 20% from October to December 2018.
The economic impact was slower growth and higher inflation. U.S. GDP growth slowed from 2.9% in 2018 to 2.3% in 2019. Business investment weakened, especially in manufacturing and trade-dependent sectors. Companies faced higher costs for imported materials (e.g., steel for automakers). Farmers were hit hard as China retaliated with tariffs on U.S. soybeans, leading to a decline in agricultural exports.
The Fed initially raised rates in 2018 but reversed course in 2019, citing trade uncertainty. The Fed cut rates three times in 2019, helping support markets. In turn, markets rebounded in 2019 as investors reacted to monetary policy easing and a possible trade deal. The bond market signaled concerns about economic slowdown, as seen in falling Treasury yields and an inverted yield curve. The broader economy experienced slower growth, weaker business investment, and increased costs for companies and consumers, though it avoided a recession before the COVID-19 shock in 2020.
Details of Some of the Tariffs
Here are some details of the tariffs and retaliatory measures taken by our trading partners:
- Impact on the Auto Industry
President Donald Trump’s tariffs on imports from Canada, Mexico, and China threaten to disrupt the North American auto industry significantly. The tariffs, especially a 25% duty on vehicle imports, could escalate vehicle prices and disrupt production. In 2024, the import market for auto parts reached $225 billion according to Alix Partners, a consultancy, and tariffs are expected to add $60 billion in costs, which may be passed on to consumers. The tariffs could add $3,000 to the price of a new car according to Wolfe Research, further exacerbating affordability issues. Additionally, vehicle parts are often moved back and forth across borders multiple times, compounding costs.
- Agricultural Products
The tariffs will also impact the U.S. agricultural sector, with significant disruptions to produce imports. About 50% of vegetables and 40% of fruits imported into the U.S. come from Mexico. Mexico is also the primary supplier of avocados, bell peppers, cucumbers, and squash, as well as tomatoes. Tariffs will likely lead to higher food prices for consumers.
- Imports from Canada and Mexico
Both Canada and Mexico are major suppliers of goods to the U.S.:
- Auto Parts: Nearly 50% of U.S. auto parts come from these countries, with air bags and seat belts being nearly 80% sourced from them. Note that it will be impossible to make a complete vehicle without these latter two items.
- Clothing: Tariffs on Chinese goods could cause clothing prices to rise by up to 2%, according to Bloomberg Economics.
- Energy: The U.S. imports 60% of its oil from Canada, and tariffs on Canadian oil threaten to raise fuel prices, particularly in the Midwest, which is where Canadian crude oil is refined. Refineries that can process Canadian crude oil are not able to refine other grades of petroleum from other areas.
- Lumber: Softwood lumber, about 30% of which is imported from Canada, faces tariffs that could increase the cost of housing, worsening affordability issues. This comes at a particularly bad time when there will be a massive building effort in Southern California following the devastating wildfires that destroyed entire communities, displacing thousands of households.
Conclusion
So far, the effects of the tariffs, unless they are removed soon, do have the potential to both slow economic growth and increase inflation in the U.S. That is a primary reason for the sell-off in U.S. equity markets in recent days.
Volatility is to be expected in environments such as this, but over time markets will adjust as companies diversify supply chains or find ways to absorb costs. While tariffs are driving the markets today, investors would be well served to focus on earnings, fed policy, and economic growth.
Importantly, given the dynamic nature of how quickly tariffs can be modified, or even removed, making portfolio management decisions based on shifting data can be fraught with difficulties. Oftentimes, when conditions are in flux, it makes sense to take a longer term perspective and not make decisions on what may prove to be transitory. After all, a solid company last week may very well continue to be a good investment next week, regardless of geopolitical events.
At SEIA, we closely monitor economic and geopolitical developments as they unfold. Please reach out to your financial advisor should you have any questions or desire more information. We always are ready to assist you on your investment journey.
The information contained herein is for informational purposes only and should not be considered investment advice or a recommendation to buy, hold, or sell any types of securities. Past performance does not guarantee future results. For details on the professional designations displayed herein, including descriptions, minimum requirements, and ongoing education requirements, please visit seia.com/disclosures. Signature Estate & Investment Advisors, LLC (SEIA) is an SEC-registered investment adviser; however, such registration does not imply a certain level of skill or training and no inference to the contrary should be made. Securities offered through Signature Estate Securities, LLC member FINRA/SIPC. Investment advisory services offered through SEIA, 2121 Avenue of the Stars, Suite 1600, Los Angeles, CA 90067, (310) 712-2323.
Third Party Site
The information being provided is strictly as a courtesy. When you link to any of the websites provided here, you are leaving this website. We make no representation as to the completeness or accuracy of information provided at these websites. Nor is the company liable for any direct or indirect technical or system issues or any consequences arising out of your access to or your use of third-party technologies, websites, information and programs made available through this website. When you access one of these websites, you are leaving our web site and assume total responsibility and risk for your use of the websites you are linking to.
Dated Material
Dated material presented here is available for historical and archival purposes only and does not represent the current market environment. Dated material should not be used to make investment decisions or be construed directly or indirectly, as an offer to buy or sell any securities mentioned. Past performance cannot guarantee future results.